In this project we will explore:
- Interacting with InfluxDB
- Analytics and monitoring in Grafana
- App development in Python
The code repository is available on GitHub.
InfluxDB
InfluxDB is an open source time series database for recording metrics, events, and analytics.
Installing InfluxDB locally includes an influx CLI. Launch a local database connection with:
$ influx
Connected to http://localhost:8086 version 1.8.5
InfluxDB shell 1.8.5
>
From the CLI we are able to create a new database.
> create database db1
> SHOW DATABASES
name: databases
name
----
_internal
db1
The _internal database is created and used by InfluxDB to store internal runtime metrics.
Insert and query data
- Measurement is the part of the InfluxDB data structure that describes the data stored in the associated fields.
- Field is the key-value pair in an InfluxDB data structure that records metadata and the actual data value.
- Tag is the key-value pair in the InfluxDB data structure that records metadata.
In InfluxDB, a timestamp identifies a single point in any given data series. InfluxQL is the InfluxDB SQL-like query language.
To query the database we need to operate against our newly created database. Lets insert a single data point into the DB using CLI. The point with measurement name countries and tag country_code with value of 1 is written to the database.
> use db1
> INSERT countries,country_code=US value=1
Querying the data from measurement countries.
> SELECT * FROM "countries"
name: countries
time                country_code value
----                ------------ -----
1620484211870645277 US           1
Insert another data point.
> INSERT countries,country_code=NO value=1
> SELECT * FROM "countries"
name: countries
time                country_code value
----                ------------ -----
1620484211870645277 US           1
1620484410599741637 NO           1
InfluxDB Docker Compose
The InfluxDB is configured in the docker-compose.yml file. The database db1 is initialized and a user is created.
influxdb:
  image: influxdb:1.8.5
  ports:
  - '8086:8086'
  environment:
  - INFLUXDB_DB=db1
  - INFLUXDB_USER=user
  - INFLUXDB_PASSWORD=password
Grafana
Grafana Docker Compose
Grafana is configured in the docker-compose.yml file and depends on the InfluxDB service. Config files for Grafana data sources and dashboards are mounted. Since we want to visualize incoming web traffic the Worldmap Panel plugin is installed.
grafana:
  image: grafana/grafana:7.5.5
  ports:
    - '3000:3000'
  depends_on:
    - influxdb
  volumes:
    - ./grafana/:/etc/grafana/provisioning
  environment:
    - GF_INSTALL_PLUGINS=grafana-worldmap-panel
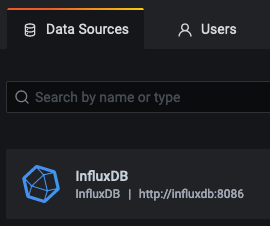
Data source
To visualize the data in Grafana we need to define a storage backend as a data source. The datastore is defined in grafana/datasources/datasource.yml.
apiVersion: 1

datasources:
  - name: InfluxDB
    type: influxdb
    access: proxy
    database: db1
    user: user
    password: password
    url: http://influxdb:8086
By default Docker Compose sets up a single network for our containers. The containers are reachable by their container name. The URL is set to the docker container name influxdb. Database and user config is set to InfluxDB values defined in the docker-compose file.
Query data
Now that the data source is defined we are ready to query our data. We choose InfluxDB as the data source and query the measurement called countries. field (value) illustrates number of incoming requests from each country. Group by country code groups query results by specified tag. The alias should be in the form $tag_<field name>.
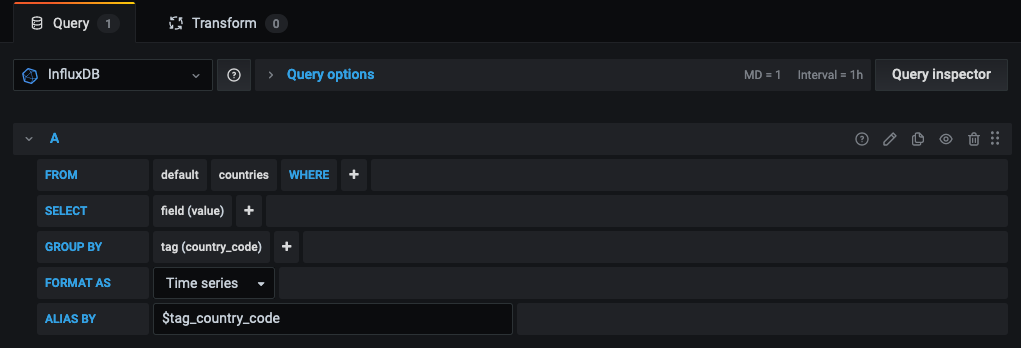
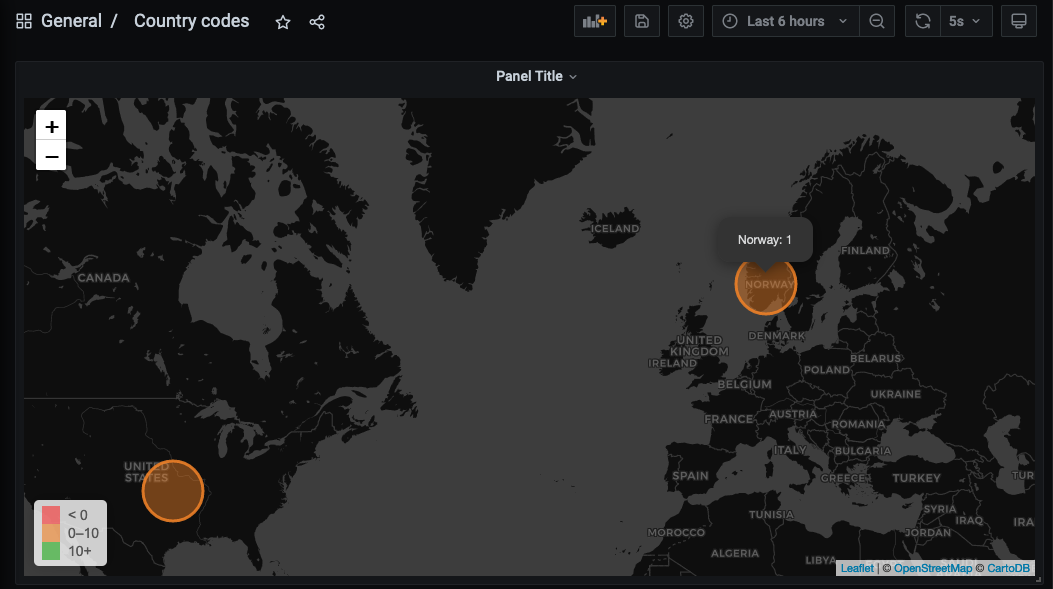
Viewing the data we inserted earlier.
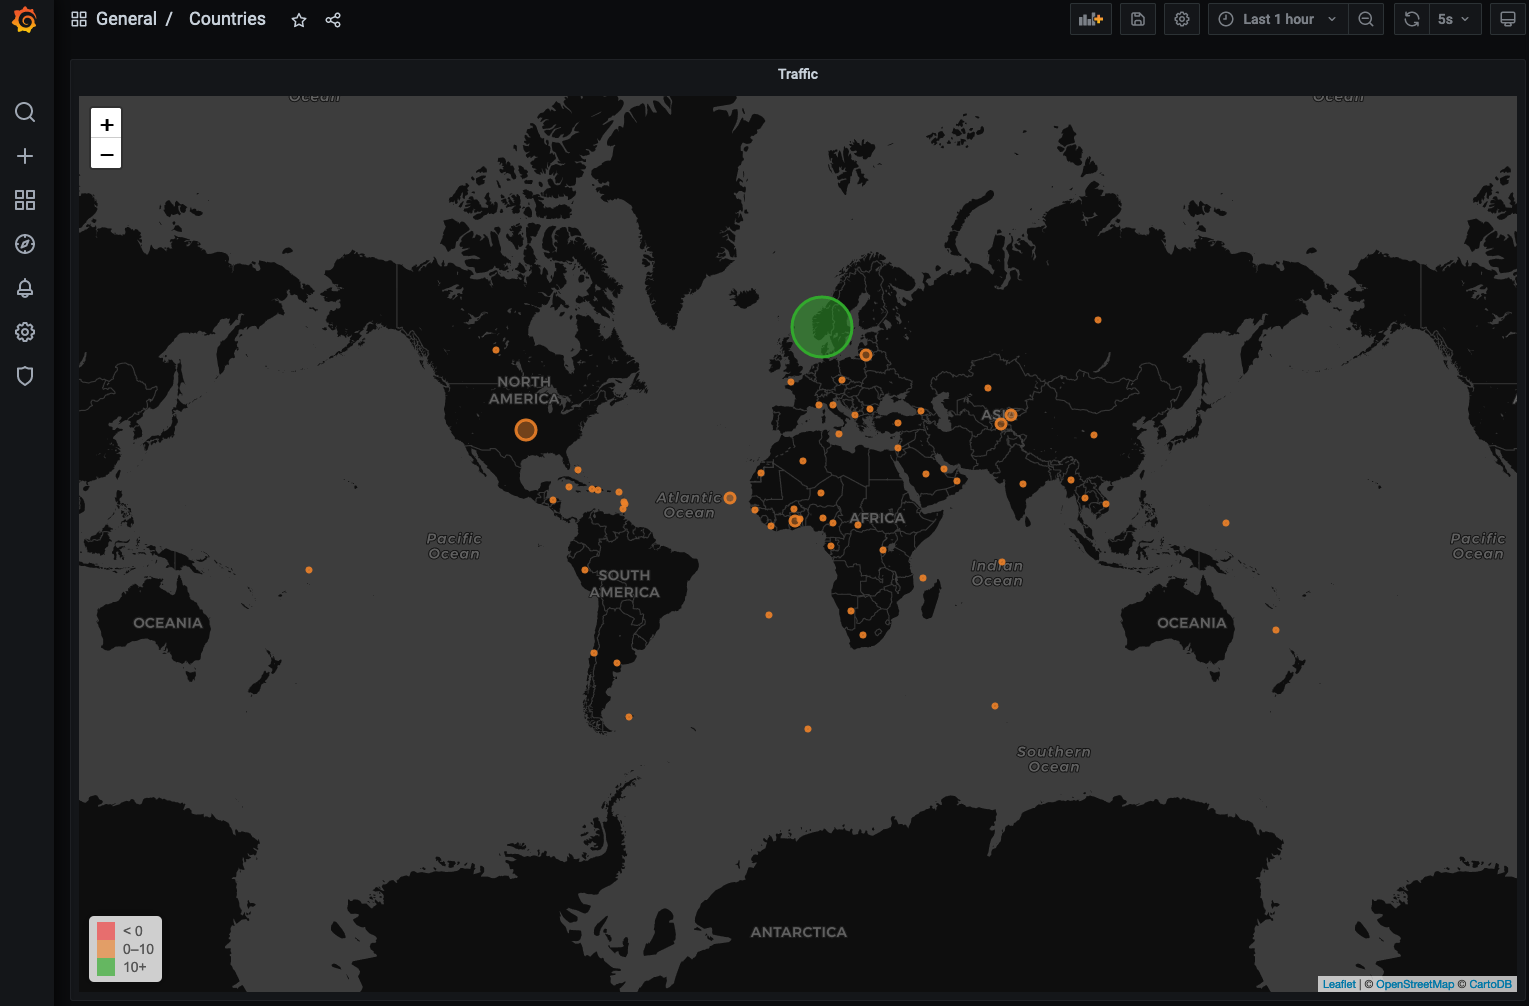
Python Application
The Python application generates random country codes and inserts JSON objects in the InfluxDB. The goal is to simulate incoming traffic to a website.
Main
Initialize DB connection and call function to write data every 5 seconds forever.
# Initialize DB connection
client = InfluxDBClient('influxdb', 8086, "user", "password", "db1")

while True:
    # Write data to DB
    client.write_points(generateJSON())
    time.sleep(5)
Data structure
Inserting data in the InfluxDB requires a measurement, tags and fields.
def generateJSON():
    json_body = [
        {
            "measurement": "countries",
            "tags": {
                "country_code": getRandomCountryCode()
            },
            "fields": {
                "value": 1
            }
        }
    ]
    return json_body
Get random country
Utilizing pycountry we choose a random country and return the alpha-2 country code.
# Get random country
def getRandomCountryCode():
    n = random.randint(0,len(pycountry.countries))
    country_code = list(pycountry.countries)[n].alpha_2
    print("Random country: " + country_code)
    return country_code
Dockerizing Python application
The Python application is dockerized with the official Python image. Required packages are defined in requirements.txt and installed with pip. Python files are copied over and ran in the entrypoint.
FROM python:3.9.2

# Copy files to image
WORKDIR /usr/src/app
COPY . .

# Install modules
RUN pip3 install -r requirements.txt

CMD ["main.py"]
ENTRYPOINT ["python3"]
Stack
Docker Compose is used to manage three containers. The stack consists of:
- Python app
- InfluxDB
- Grafana
The Python application generates data which is stored in the InfluxDB. Grafana is used to visualize the data from InfluxDB.
Deploy
To build and deploy the stack run:
make all
Go to http://localhost:3000 to view example Grafana dashboard. admin:admin is the default username and password in Grafana.
Cleanup
To destroy the stack run:
make destroy
No comments